Thermal tilting test
First, we checked to see whether the effect of sunlight shining upon the building during the day might cause the flats to tilt to and fro, due to thermal expansion of the soil or of the building. It seemed that this could be a possibility, because on a sunny day in Penonome the direct solar radiation is really very strong. The results were clear: no significant thermal tilting was taking place. For details, 
Mutual excitation test Second, we checked for mutual excitation of the pendulums (which, if it took place, would be utterly fatal for any meaningful observations). Each of the pendulums is mounted to a slab of concrete weighing about 1200 kg, and these slabs are about 4 meters apart and are mounted onto thick concrete beams and pillars in a sturdy building, so that the possibility appeared unlikely; but still it was proper to check it directly. We stopped pendulum #1 completely, so that it hung down absolutely stationary, and we positioned an indicator 0.5 mm below the end of the pointer. This setup certainly was capable of showing up movement of pendulum #1 smaller than 0.1 mm. Then we started pendulum #2 swinging, and we observed pendulum #1 to see if vibrations transferred from pendulum #2 through the fabric of the building might perhaps set it swinging slightly. We observed at intervals during 25 minutes, but saw absolutely no such induced vibration. And conversely, when we stopped pendulum #2 and set pendulum #1 swinging, the same result was obtained: no mutual excitation at all was taking place. Moment of inertia test Third, we calculated the parameters of our pendulums, in particular their principal moments of inertia I1, I2, and I3. For a MS Word file with the details, The one-week period of observation over the solar eclipse of 8 April 2005 The observing team, with colleagues: (You can see how carefully the height of the platform was planned - the heads of our two tallest members are just brushing the ceiling!) We started around noon on 5 April, and carried on through the solar eclipse of 8 April, concluding in the evening of 12 April. This continuous experiment over a period of about 170 hours using two pendulums is, we believe, the longest performed since Maurice Allais performed his seven marathon series in the 1950's, each during one month non-stop. During the entire run we recorded ambient pressure, temperature, and humidity at 15 minute intervals, using a basic Davis Instruments "Perception II" electronic weather station. For an MS Word file with the data, To repeat what is stated elsewhere, our invariable operational methodology was to release each pendulum from a fixed point and to let it oscillate for twelve minutes. The start azimuth and end azimuth of the plane of vibration were recorded, and the difference between these was taken as the amount of precession. The pendulum was then reset and allowed to steady itself, for which we allowed three minutes. Thus we operated on a fifteen-minute cycle for each pendulum, using fixed azimuths of swing. These azimuths were mutually perpendicular, and were 1100/2900 for pendulum #1 and 200/2000 for pendulum #2. [If you want to study our data seriously, you should download the Excel spreadsheets from the main report page; here only a summary of the points of interest is presented.] We moved and/or changed the position of the balls on the flats about once every twenty-four hours, but at a schedule which was purposely somewhat irregular. Each of these resettings caused a short gap in the data. And once (in the evening of 10 April) an interesting operational error led to the loss of eight data points for pendulum #2. Operation was continuous, day and night, apart from these gaps. First, here is a chart showing how pendulum #1 behaved on 7 April, which is quite representative. The green line just connects the data points; it hasn't been smoothed at all. As in all our charts, the vertical axis shows the amount of precession of the plane of oscillation of each pendulum in arbitrary angular units, of which one corresponds to about two degrees. A minus sign denotes a clockwise precession, and vice versa. The Foucault effect in Penonome (8030'N) is about two degrees per hour clockwise, i.e. about -0.2 in our units for each twelve-minute run. As a general comment, the self-consistency of the raw data is remarkable. It is clear that our apparatus is working extremely well, with only minor aleatory effects. I credit this fact to the highly accurate balls and flats, which are at least an order of magnitude better than those available in the time of Prof. Allais. To quote Latham, who was the first person to see these undulatory effects: "there is in all cases evidence of cyclic effects, rather irregular perhaps, but nonetheless effects which move steadily up and down over many runs, the change being much larger than the random errors". A typical figure extracted from Latham's "Report No. 28" of 1980 (available on the prior art section of this website) Before going into the details, I'd like to emphasize the science-fictional nature of these results. These pendulums are certainly the most delicate, accurate, and sensitive 'physical pendulums' in the world today. We have released them in exactly the same circumstances hour after hour, day after day. The pendulums are shielded from air currents and are completely non-magnetic. One would expect that they would do substantially the same thing upon each release. But they don't. Their behavior varies over time in a clearly non-random and self-consistent manner. Why? That's not in the physics books! Although this is not quite kitchen-table science, this simple apparatus (except for the highly accurate balls and flats) has been built in common workshops by a dedicated amateur, and it could easily be duplicated anywhere. I am not aware of any other situation in current physics where clear anomalous results can be reliably reproduced with simple molar-scale equipment. I think it is certain that the pendulums are being influenced by causes external to the laboratory, and since there is no clear geophysical culprit, I think that the cause is one or more forces or pseudo-forces of non-terrestrial origin. The Sun and the Moon are obvious candidates as root causes, although conventional textbooks on rigid dynamics do not envisage the possibility of solar or lunar effects upon a physical pendulum. The only reasonable alternative is a cosmic effect, i.e. one not originating within the solar system. [If solar and lunar influences were not effective, I do not believe that planetary effects could be.] The acid test will be spectral analysis. It is not clear that we yet have sufficient data, but certainly the characteristic period of a solar effect will be 24 hours or a submultiple thereof such as 12 hours, the characteristic period of a lunar effect will be (about) 24 hours 50 minutes or a submultiple thereof such as 12 hours 25 minutes, and the characteristic period of a cosmic effect will be sidereal, i.e. 23 hours 56 minutes or a submultiple thereof. But, whereas it may well be possible to ascribe the variations whose characteristic variations are on the order of 12 or 24 hours to the Sun or the Moon, there is no way that undulations on the scale of two to three hours can be due to solar or lunar effects. There is no known astronomical phenomenon that can create changes on such a time scale, at least according to current physics. Now, here's all the results for both pendulums for seven days in a great long line, so you can get an overall idea of the motion. In this and the subsequent charts, as in the spreadsheets, the unsmoothed raw data for each pendulum is shown by a faint line, while its three-point moving average is shown by a thick superimposed trendline. An Eclipse Effect ? Pan to the right along this long chart and look at the afternoon of 8 April. Clearly there wasn't any particular effect around the moment of greatest eclipse. And our apparatus is so delicate and has been operated so consistently that, if there had been an effect in these circumstances, we would have seen it. I think we can confidently say that, at this low latitude, directly upon the eclipse line, when the eclipse takes place low in the Western sky (i.e., according to my nomenclature, an "equatorial tangential" eclipse), there is no eclipse effect. But this by no means precludes the possibility of an eclipse effect occurring in other circumstances, and I am by no means controverting Allais's 1954 observation. -o0o- Characteristics of the Undulations It should be remembered that our two pendulums are not parallel - they are set up so as to vibrate in mutually perpendicular planes. Thus - assuming that they are reacting to some genuine external influence - there is no particular reason to suppose that they will behave similarly at similar times. It depends upon the type of influence and the way in which its manifestation in two perpendicular directions varies over time. If for example - to speculate - the influence can be described as a modification of the Foucault effect, then it will act similarly on both pendulums, so that their charts will be similar. But if the influence can be described as a vector which has NS and EW components, then if the magnitude of the vector but not its direction changes over time, it will act similarly upon both pendulums and their charts will be similar, whereas if its magnitude changes as well as its direction, then the charts need not have any particular mutual relation. Since we have established by experiment that the two pendulums do not influence one another directly, we can assert the following "win-win" theoretical principle:
If (over some reasonably long period) both pendulums yield similar charts, then (over that period) they are both reacting to the same external influence, and this constitutes objective evidence of such an influence;
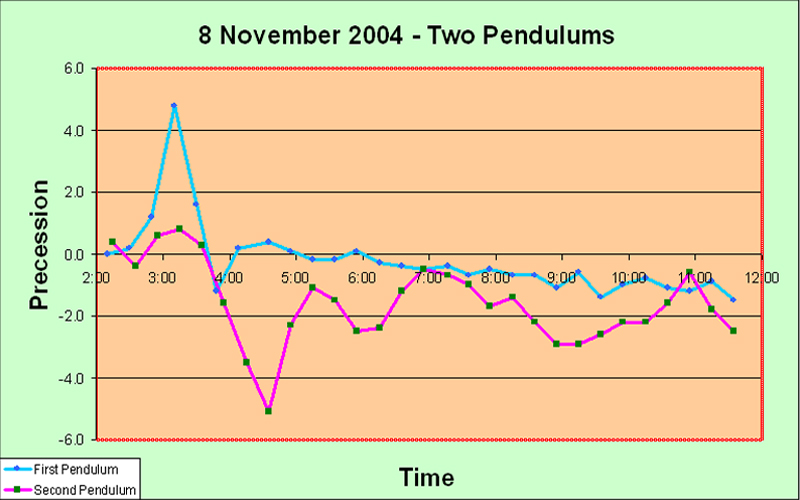
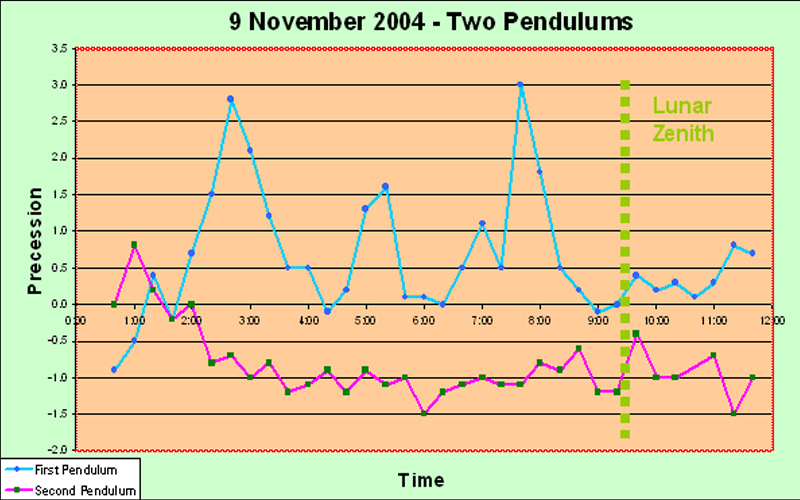
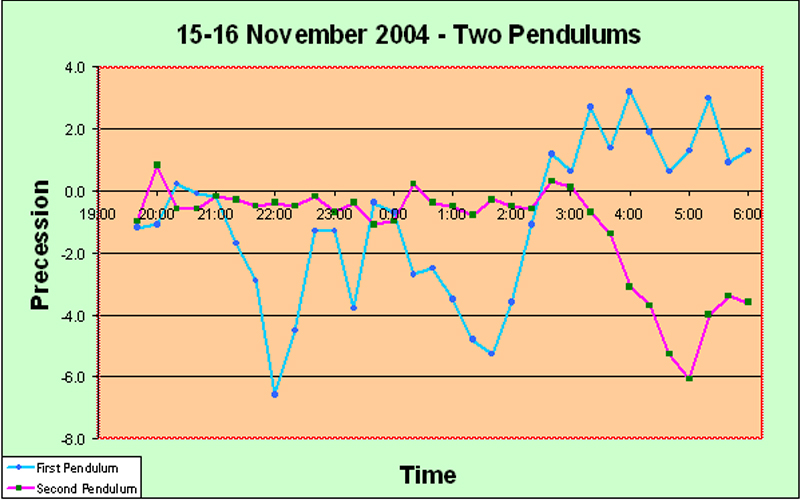
But if (over some other reasonably long period) the pendulums yield different charts, this is not, per se, evidence of no external influence. (This second would not be the case, if the pendulums were swinging in parallel.) So, look at the charts for the two pendulums for April 6 and April 7: Even by eye, it is clear that, on both April 6 and April 7, the pendulums were behaving in a correlated manner. This proves the existence of some common objective external cause - even though such behavior was not manifested on other days (at least, not so clearly). (We are aware that these remarks highlight a procedural lacuna in our work. If we were to set up two identical pendulums swinging in parallel, then - assuming that their behavior has an extrinsic cause - they should always show similar graphs, and this would be utterly conclusive. The proof would be reinforced, if the pendulums were set up in different buildings spaced apart by several hundred meters. At some future stage we shall certainly implement this arrangement.) Compare these results with those recently obtained by Professors Cahill and McCarthy in Adelaide, Australia. (These are described more fully in the Australia section of this report.) Using two pendulums vibrating with perpendicular initial azimuths, their team obtained the precession curves shown in this chart: Correlated behavior is clear; yet these pendulums were well separated and could not influence one another. Obviously, on opposite sides of the terrestrial globe, by doing the same thing, we have been detecting the same type of phenomenon. Next, see the following summary chart in which the graphs showing the precession behavior of our Panama pendulum #1 for each of the eight days of the run are superimposed. This chart deserves the very greatest attention: It is immediately obvious that the graph lines for the various days are quite different from one another, but that they gather together at the approximate times 11:00, 17:00, and 23:00. These times are spaced apart by just six hours, which cannot be coincidental. But it is very interesting that at the fourth time in the series, i.e. 05:00, the lines do not gather together at all. Gathering together of the graph lines at some hour of the day, means that the pendulums were behaving in the same manner at that time on each day. We also see that, at these gatherings, the amount of precession was approximately zero; actually, at 11:00 and 23:00 the precession was very slightly positive (anticlockwise), whereas at 17:00 it was very slightly negative (clockwise). So at these times of day, the external influences upon pendulum #1 were consistent, and substantially minimal. Now here is the corresponding chart for pendulum #2: Two gatherings are immediately obvious: the one near 11:00 (actually here somewhat before, maybe about 10:30), and the one at 17:00. Both have slightly negative precession. There is no evidence of the gathering near 23:00 at all. However, there does seem to be a rather unclear gathering near 06:00, with significant precession. These results bear interesting comparison with those obtained over the same period by Professor Hector Munera in Bogota, Colombia, about 800 km from our apparatus in Penonome. (These are described more fully in the Colombia section of this report.) Again, he used two pendulums vibrating with perpendicular initial azimuths. However, the support structures are not as solid as ours in Panama. For pendulum #1 (swinging at 45o), his team obtained the precession curves shown in this chart: A single gathering together at 17:00 is clearly apparent, with essentially zero precession value. (The Foucault effect is very small at the latitude of Bogota.) Prof. Munera and I therefore have succeeded in demonstrating, for the first time ever, correlated anomalous behavior over the same time period for paraconical pendulums separated by hundreds of kilometers. For completeness, we give Professor Munera's results for his pendulum #2 (swinging at 135o). This pendulum behaved very erratically at all times, and both Prof. Munera and we suspect some structural fault. The precession amounts have been divided by 5, to bring them to a similar scale as that of the other pendulums. No particular clustering is visible. No clear conclusions can be drawn from the behavior of this pendulum. Possible Conclusions What can be the significance of these "gatherings" of the graphs? A gathering means that, reliably at that time every day, the external undulatory influence upon the pendulum temporarily drops to near zero. It is not very likely that a purely solar effect would happen repeatedly at 11:00 and 17:00 and 23:00, bearing in mind that the Sun passes the meridian in Penonome at about 12:30 every day, and rises at 06:30 and sets at 18:30. One would expect a solar effect to occur at meridian or anti-meridian passage, or at sunset and sunrise. An alternative possibility would be a sidereal effect. We can only lay forth the following speculations... At 17:00 local time (22:00 UT) on 8 April 2005, the hour of our tightest graph gatherings, the sidereal time at Penonome was 05:48. We owe the following suggestion to Joseph Keller of Iowa State University. The right ascension of Sagittarius A, the putative black hole at the center of our galaxy, is 17:47 - exactly opposite to our gathering RA of 5:48. Moreover, the declination of Sagittarius A is 30oS, so that, when Penonome is on the opposite side of the Earth to Sagittarius A, its direction is only about 22o off the vertical - as close as it ever gets at that location. Almost along the line of the pendulum rod... Maybe a station at latitude 30oN or 30oS should be built? As can be seen from the following figure extracted from Miller's 1933 paper, the RA during April of the direction in which (according to his logic) he figured out that the solar system was moving through the aether was about 04:00, which is a bit different, but not wildly different, from our "gathering" time. The following figure is extracted from DeWitte's website, in which he describes his historic experiment with synchronization of atomic clocks in detail. The RA when he obtained minimum delay was about the same as our 05:48. There is some interest in referring back to our work in Malaysia in November/December 2004 and revisiting the (rather few) charts that we obtained when operating our paraconical pendulums at that time. Remember that our pendulums in Malaysia were not oscillating in mutually perpendicular azimuths; rather, they vibrated in parallel, but utilized bobs with radically different moments of inertia - so the pendulums were different, as in Panama, but they were different in a different way. On 8 November 2004 we obtained the following chart: 2:10 local time on that night corresponded to 4:39 sidereal time, while 3:40 local time corresponded to 6:09 sidereal time - which is not very far from the sidereal hour of 5:48 identified above... 1:30 local time on that night corresponded to 4:02 sidereal time. There is no real correlation with 5:48 sidereal time here. 2:30 local time on that night corresponded to 5:30 sidereal time. Pretty accurate for 5:48... 21:30 local time on that night corresponded to 1:48 sidereal time, and 22:30 local time corresponded to 2:48 sidereal time, while 01:30 local time corresponded to 05:49 sidereal time. This last one is absolutely spot on! Clearly, the only way in which we can figure out whether our observed effects are solar or sidereal is to perform a much longer observational run. The team in Penonome is active and ready... The end-of-run dinner party: Sometimes physics can be a lot of fun in Panama.... -o0o- Further Results The team in Penonome have now proceeded to make observations on their own (without my presence) over the period of the lunar eclipse, the maximum of which took place at about 10:00 UT on 24 April, which corresponds to 05:00 local time on 24 April in Panama They observed for about 72 hours non-stop on 23, 24, and 25 April. They obtained the following graphs: No particular lunar eclipse effect appears - as was the case with our observations in Malaysia over the October 24th lunar eclipse. We are not surprised. As before, we scrutinize these charts for any characteristic gathering together of the lines, and it is immediately clear that, on all three days, for both of the pendulums, the graphs bunch together at about 19:00 to 19:30 local time. As in the case of the previous run, this is very unlikely to be coincidental. Moreover, for pendulum #1, the graphs gather at about 07:20, which is just 12 hours earlier. And for pendulum #2, the graphs for 24 April and 25 April meet at 08:00, but the graph for 23 April - the first day on which the team operated by themselves - doesn't come anywhere near them at that time. Nature doesn't always do what one expects! The time of 19:20 local corresponds to 09:11 local sidereal time - which has no relation to any sidereal time that has appeared previously. If the previous local sidereal time of 05:48 had been maintained, the local time of the gathering would have been slightly before 16:00 - but actually, at that time, there are no signs of gathering at all. So the mystery deepens... During the period of the first observational run over the solar eclipse, the Moon was generally in the same part of the heavens as the Sun, whereas during this second run over the lunar eclipse, the Moon was generally opposite to the Sun. This intrinsic difference no doubt has a lot to do with the different character of the charts, but we haven't nearly enough data yet to draw any clear conclusion. What is clear is that, if it had been possible to maintain continuous observation from 13 April through to 23 April as well, so as to connect up these two observational series, we would be able to figure out a lot more than we can at the moment. We would have been able to track the migration or change of these "gathering points" and to perform much more meaningful spectral statistical analysis. This all serves to underline the correct logic of Prof. Allais's original approach to these pendulum experiments, which was to perform non-stop observations for periods of a month or more. In any investigation in which the Moon is a primary suspect for causing some or all of the anomalous effects, a month must be considered to be the minimum meaningful observational period. Investigations will continue. -o0o- Back to the main eclipse report page (which has the downloads). Back to our website main page. Then we actually tested the relative values of I1 and I2 for one of the pendulums by swinging; for the details, Briefly, our calculations for these relative values, i.e. for Prof. Allais's "coefficient of asymmetry", were verified to within 10%.

This data doesn't appear to have any particular correlation with the precession amounts of the pendulums; we consider such claims as pure red herrings.